See what your home is really doing —
to the planet, and your bill.
Grid.Local pairs live UK regional grid carbon with your energy data — automatically via Octopus Energy and GivEnergy, or by uploading your own figures. See your home's true footprint, what you actually pay, and how a different tariff or battery would change things — all in one place.
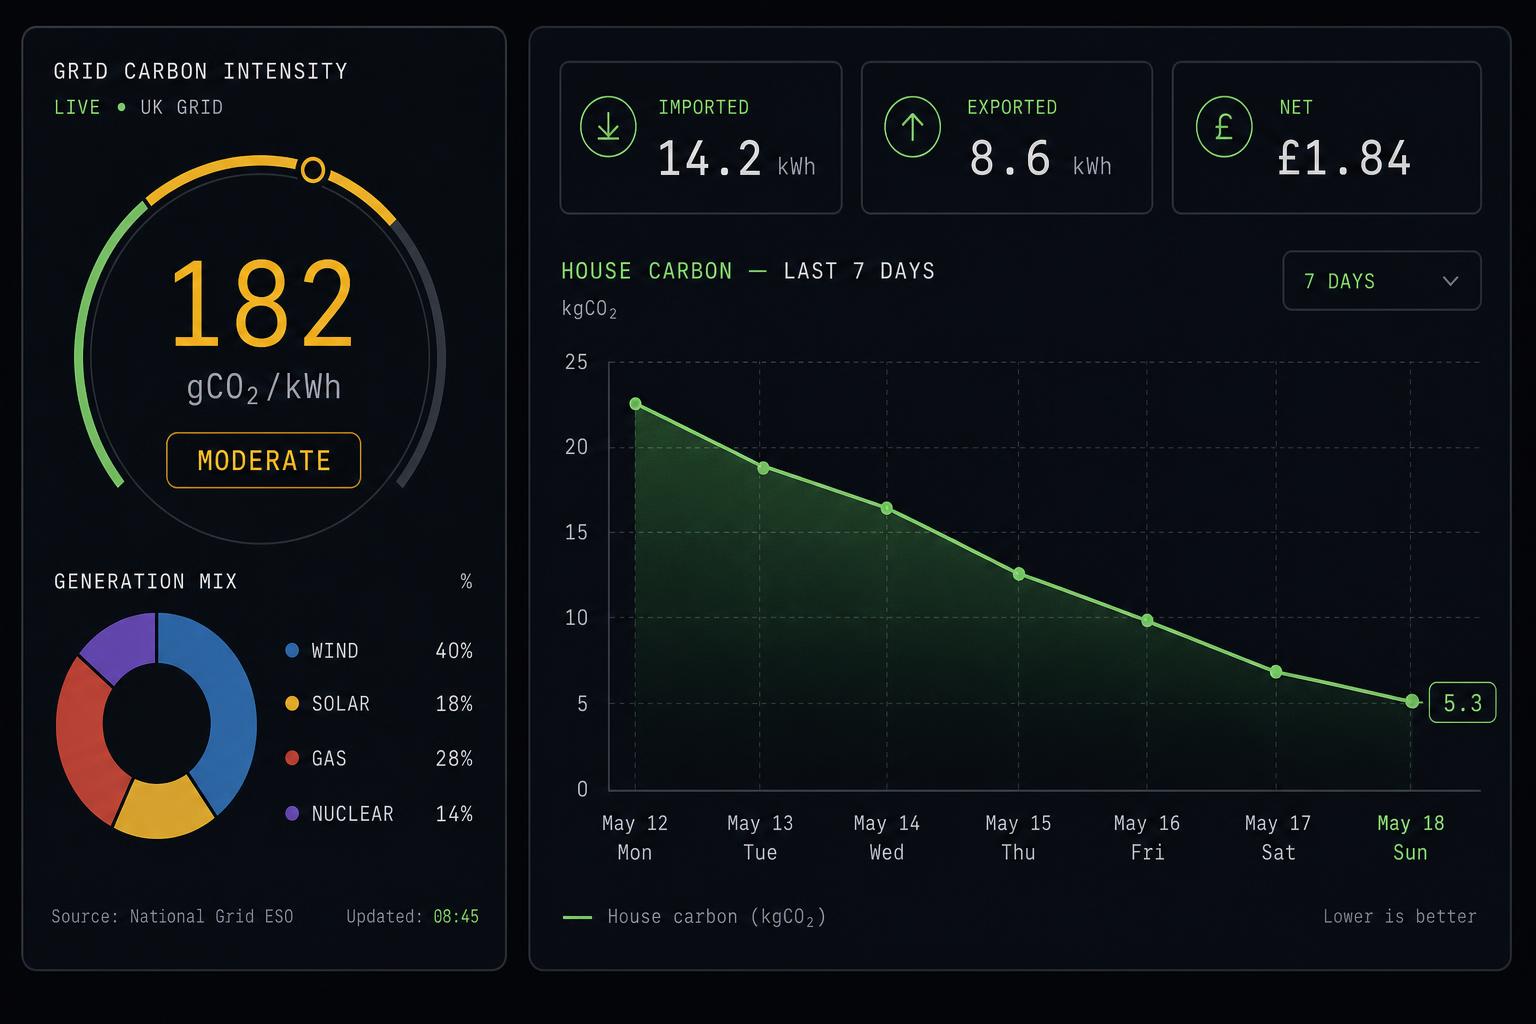
Live grid carbon
Real-time gCO₂/kWh for your DNO region, refreshed every 30 minutes. See the live generation mix — wind, solar, gas, nuclear — and when it's the greenest moment to run the dishwasher.
Your home's footprint
Your actual carbon from grid imports, minus what your solar exports save the grid. Day, week, month, year — see the impact of every kWh you use and produce.
What you really pay
Track what you've spent on Octopus Agile, Cosy, Go or Flux — or just enter your monthly totals. Instantly see what the same usage would have cost on a different tariff. No spreadsheets.
Versus the UK average
How your home stacks up against the average UK household and against the live grid mix. A simple, honest scorecard for the changes you make.
Bring API keys for live data, or upload a CSV, monthly totals, or annual figures from any supplier or inverter.
Up and running in two minutes.
Enter your postcode
We figure out which UK region you're on and pull live grid carbon for you.
Connect your accounts
Add your Octopus API key and (optionally) GivEnergy in about two minutes. Or skip APIs and upload your own data.
Watch it update live
Your carbon, costs and tariff comparisons start filling in straight away — no waiting for monthly bills.